CPU Monitoring Configuration
This procedure outlines the steps to configure Streaming Telemetry with CPU monitoring in OcNOS. CPU monitoring helps prevent overload during high utilization by pausing telemetry sessions when the CPU crosses a configured threshold.
Prerequisites
Ensure that the streaming telemetry is correctly configured with the appropriate sensor groups, destination groups, and subscriptions.
| 1. | Enable streaming telemetry on required VRFs, and set the ports and tunnel retry interval. |
!
ip vrf management
!
ip vrf vrf1
!
feature streaming-telemetry vrf vrf1
 grpc-tunnel-server retry-interval 30
!
feature streaming-telemetry vrf management
 port 35000
 grpc-tunnel-server retry-interval 30
!
feature streaming-telemetry
 port 36000
 grpc-tunnel-server retry-interval 30
!| 2. | Define sensor groups and paths to device metrics that are published as telemetry data. |
sensor-group int vrf vrf1
 sensor-path ipi:/components/component[name="RAM"]/ram/state
 sensor-path ipi:/components/component[name="CPU"]/cpu/state
 sensor-path ipi:/components/component[name="HARD-DISK"]/storage/state
 sensor-path ipi:/components/component[name="PSU-1"]/power-supply/state
 sensor-path ipi:/components/component[name="FAN-3"]/fan/state
 sensor-path ipi:/interfaces/interface[name="eth0"]/state
 sensor-path ipi:/components/component[name="CHASSIS"]/state
 sensor-path /interfaces/interface[name="eth0"]/state
 sensor-path /interfaces/interface[name="xe4"]/state/counters
 sensor-path /components/component[name="RAM"]/state/memory
 sensor-path /components/component[name="CPU"]/cpu/utilization/state
 sensor-path /components/component[name="HARD-DISK"]/state
 sensor-path /components/component[name="HARD-DISK"]/state/memory
 sensor-path /components/component[name="HARD-DISK"]/state/temperature
 sensor-path /components/component[name="CHASSIS"]/state
 sensor-path /components/component[name="CHASSIS"]/state/memory
 sensor-path /components/component[name="CHASSIS"]/state/temperature
!
sensor-group ipi vrf management
 sensor-path ipi:/components/component[name="RAM"]/ram/state
 sensor-path ipi:/components/component[name="CPU"]/cpu/state
 sensor-path ipi:/components/component[name="HARD-DISK"]/storage/state
 sensor-path ipi:/components/component[name="PSU-1"]/power-supply/state
 sensor-path ipi:/components/component[name="FAN-3"]/fan/state
 sensor-path ipi:/interfaces/interface[name="eth0"]/state
 sensor-path ipi:/components/component[name="CHASSIS"]/state
 sensor-path /interfaces/interface[name="eth0"]/state
 sensor-path /interfaces/interface[name="xe4"]/state/counters
 sensor-path /components/component[name="RAM"]/state/memory
 sensor-path /components/component[name="CPU"]/cpu/utilization/state
 sensor-path /components/component[name="HARD-DISK"]/state
 sensor-path /components/component[name="HARD-DISK"]/state/memory
 sensor-path /components/component[name="HARD-DISK"]/state/temperature
 sensor-path /components/component[name="CHASSIS"]/state
 sensor-path /components/component[name="CHASSIS"]/state/memory
 sensor-path /components/component[name="CHASSIS"]/state/temperature
!
sensor-group ipi1
 sensor-path ipi:/components/component[name="RAM"]/ram/state
 sensor-path ipi:/components/component[name="CPU"]/cpu/state
 sensor-path ipi:/components/component[name="HARD-DISK"]/storage/state
 sensor-path ipi:/components/component[name="PSU-1"]/power-supply/state
 sensor-path ipi:/components/component[name="FAN-3"]/fan/state
 sensor-path ipi:/interfaces/interface[name="eth0"]/state
 sensor-path ipi:/components/component[name="CHASSIS"]/state
 sensor-path /interfaces/interface[name="eth0"]/state
 sensor-path /interfaces/interface[name="xe4"]/state/counters
 sensor-path /components/component[name="RAM"]/state/memory
 sensor-path /components/component[name="CPU"]/cpu/utilization/state
 sensor-path /components/component[name="HARD-DISK"]/state
 sensor-path /components/component[name="HARD-DISK"]/state/memory
 sensor-path /components/component[name="HARD-DISK"]/state/temperature
 sensor-path /components/component[name="CHASSIS"]/state
 sensor-path /components/component[name="CHASSIS"]/state/memory
 sensor-path /components/component[name="CHASSIS"]/state/temperature
!| 3. | Configure destination groups that defines where telemetry data should be sent. Establishes IP and port of remote collector (e.g., a telemetry server or analytics engine). |
destination-group des2 vrf vrf1
 tunnel-server ip 20.1.1.2 port 10300
!
destination-group des1 vrf management
 tunnel-server ip 10.16.99.109 port 10600
!
destination-group des3
 tunnel-server ip 40.1.1.2 port 10200
!
destination-group des1
!| 4. | Create persistent subscriptions and bind a sensor group to a destination group, specifying how often data should be sent. |
subscription-name sub1 vrf vrf1
 destination-group des2
 sensor-group int sample-interval 10
!
subscription-name sub2 vrf management
 destination-group des1
 sensor-group ipi sample-interval 10
!
subscription-name sub3
 destination-group des3
 sensor-group ipi1 sample-interval 10
!
!
Topology
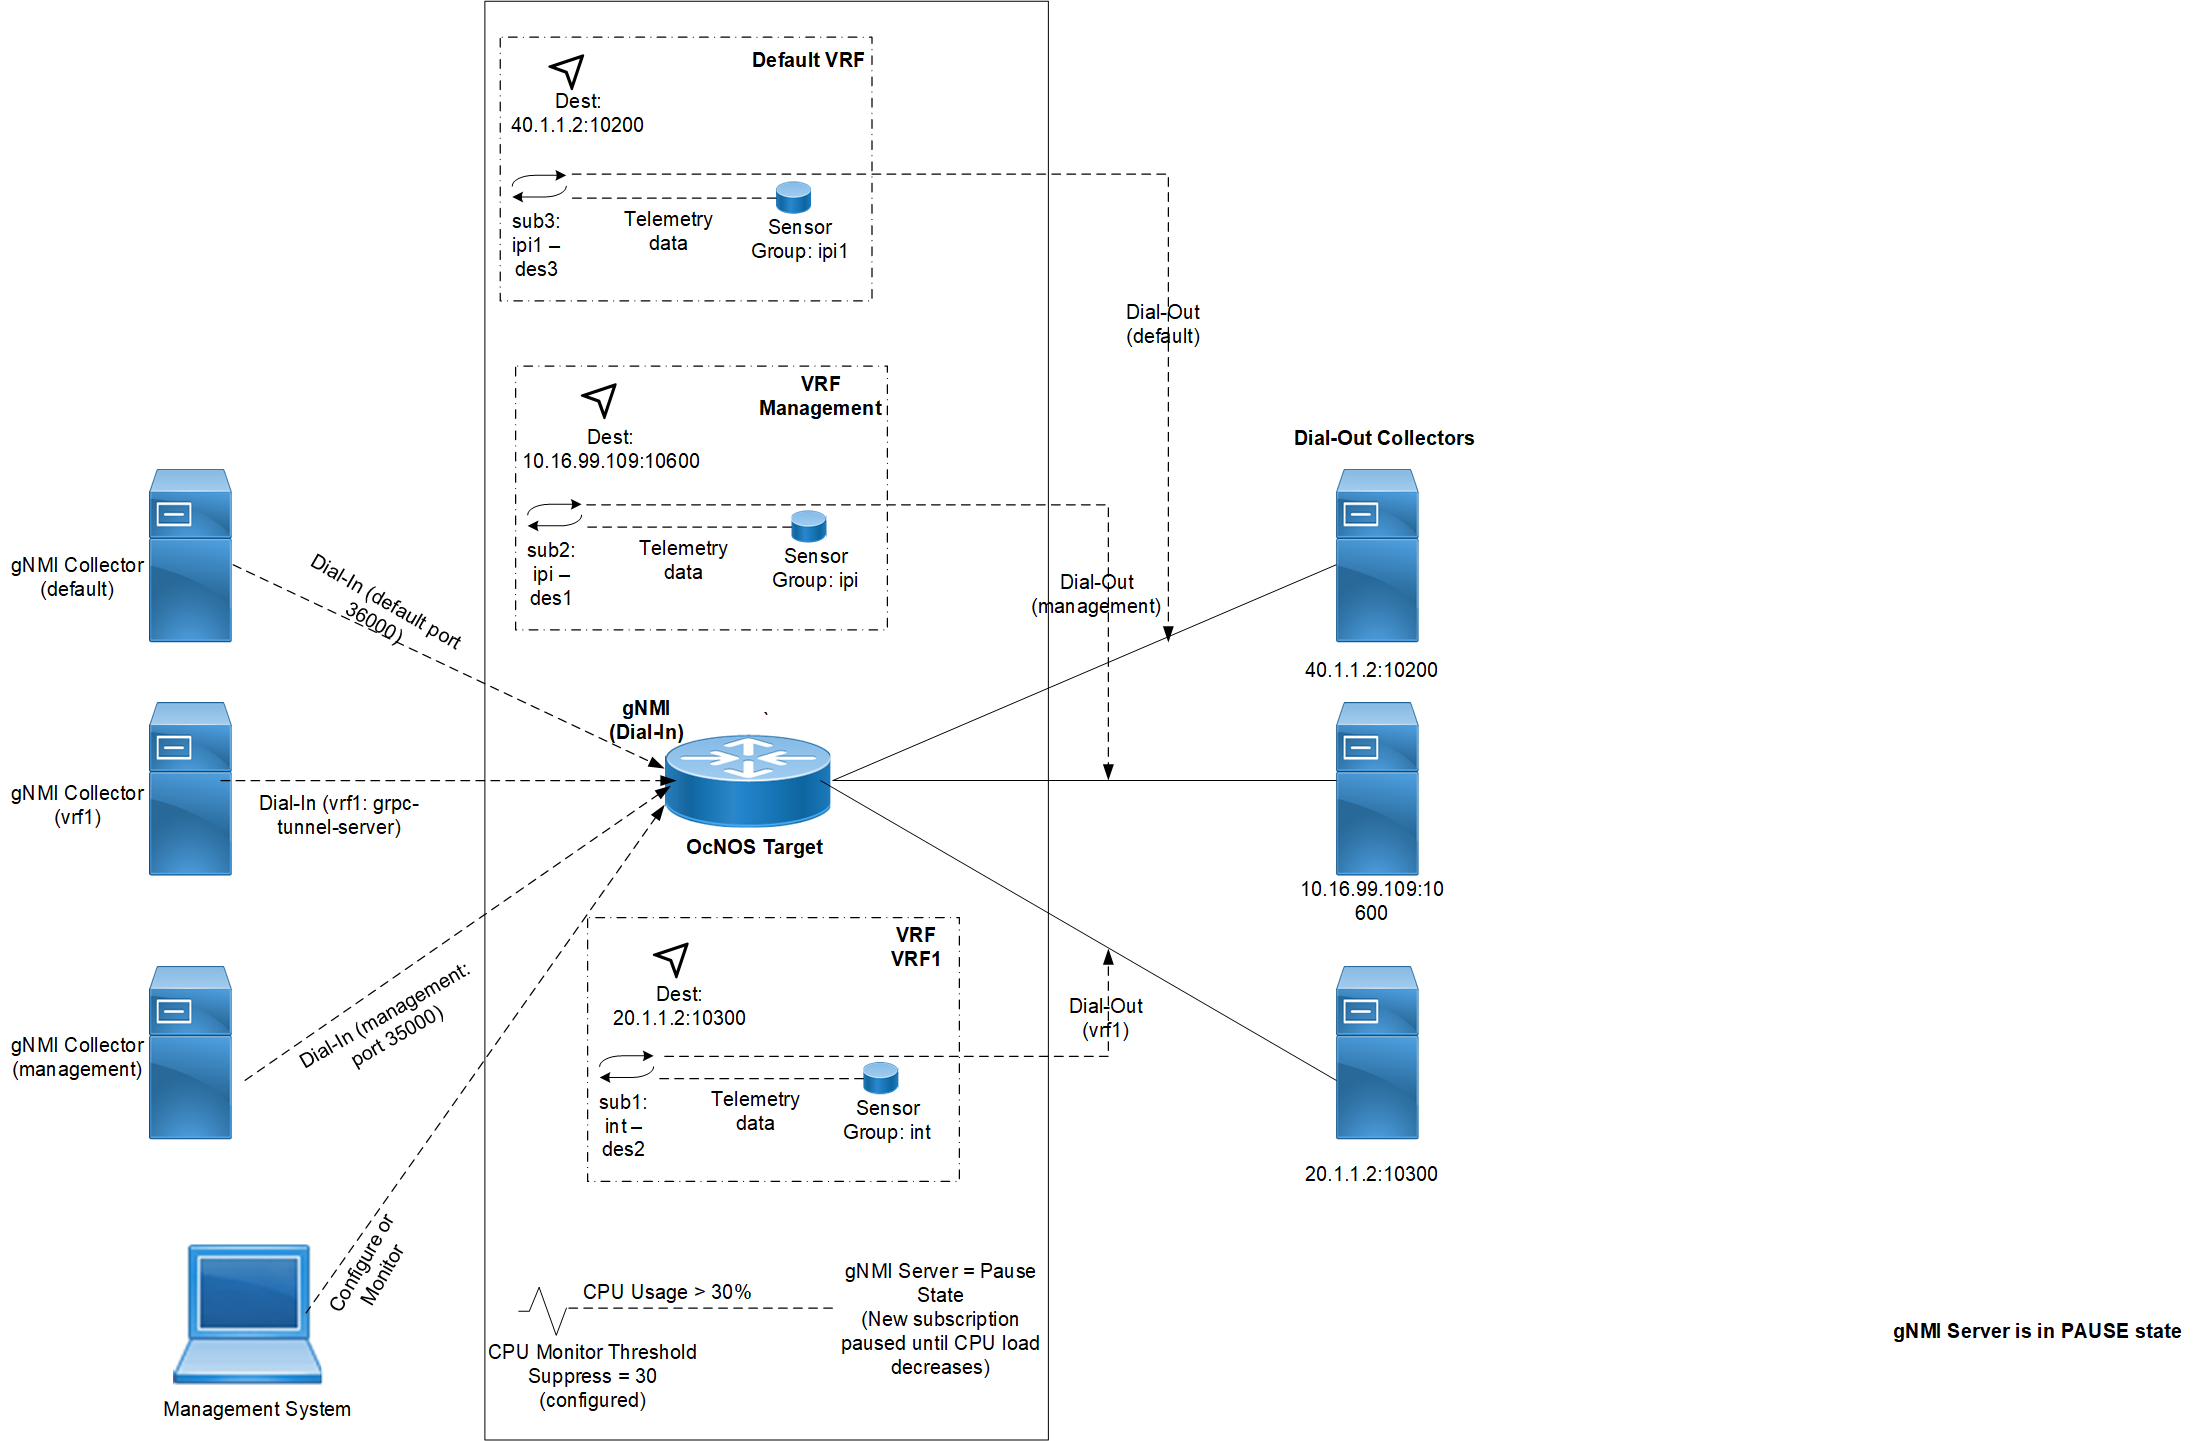
The figure below illustrates the OcNOS gNMI telemetry environment with both dial-in and dial-out connections across three VRFs: default, management, and vrf1. The OcNOS target streams telemetry data to gNMI collectors using predefined sensor groups. When a 5-minute CPU average usage exceeds the configured 30% threshold, the gNMI server enters a PAUSE state, suppressing telemetry and rejecting new subscriptions until CPU load decreases.
Key elements:
| • | Dial-In Clients: gNMI collectors initiate subscriptions via default, management (port 35000), and vrf1 tunnel-server. |
| • | Dial-Out Subscriptions: OcNOS pushes telemetry to remote collectors at specified destinations per VRF. |
| • | Telemetry Flow: Each VRF associates a subscription name, destination collector, and sensor group. |
| • | CPU Monitor Logic: If CPU > configured 30% threshold, telemetry streaming is paused, as shown by the PAUSE state indicator. |
Figure 12. Telemetry CPU Monitoring
Enable CPU Monitoring and Set Suppression Threshold
To prevent high CPU utilization from impacting telemetry responsiveness, enable CPU monitoring to manage system load dynamically. And define a suppression threshold (CPU usage percentage 30%) above which telemetry is paused.
OcNOS(config)# telemetry cpu-monitor enable
OcNOS(telemetry-cpu-monitor)# suppress-threshold 30
OcNOS(telemetry-cpu-monitor)# commit
OcNOS(telemetry-cpu-monitor)# end
gNMI Client Behavior When CPU Monitoring is Active
If CPU usage exceeds the configured threshold, the gNMI server enters the PAUSE state. New telemetry subscription requests are paused until the system CPU usage drops below the configured threshold. Below is one such scenario, in which the message confirms that the telemetry server has paused accepting new subscriptions to reduce CPU load.
# ./gnmic -a 10.16.154.118:35000 -u ocnos -p ocnos --encoding json_ietf --insecure --mode STREAM --stream-mode sample --sample-interval 90s subscribe --path 'ipi:/interfaces/interface[name="eth0"]/state' --log
2025/06/11 11:57:50.415698 [gnmic] version=dev, commit=none, date=unknown, gitURL=, docs=https://gnmic.openconfig.net
2025/06/11 11:57:50.415717 [gnmic] using config file ""
2025/06/11 11:57:50.415822 [gnmic] starting output type file
2025/06/11 11:57:50.415861 [gnmic] queuing target "10.16.154.118:35000"
2025/06/11 11:57:50.416005 [file_output:default-stdout] initialized file output: {"Cfg":{"FileName":"","FileType":"stdout","Format":"json","Multiline":true,"Indent":"  ","Separator":"\n","OverrideTimestamps":false,"AddTarget":"","TargetTemplate":"","EventProcessors":null,"MsgTemplate":"","ConcurrencyLimit":1000,"EnableMetrics":false,"Debug":false}}
2025/06/11 11:57:50.416085 [gnmic] starting target "10.16.154.118:35000" listener
2025/06/11 11:57:50.416156 [gnmic] subscribing to target: "10.16.154.118:35000"
2025/06/11 11:57:50.417046 [gnmic] target "10.16.154.118:35000" gNMI client created
2025/06/11 11:57:50.417086 [gnmic] sending gNMI SubscribeRequest: subscribe='subscribe:{subscription:{path:{origin:"ipi" elem:{name:"interfaces"} elem:{name:"interface" key:{key:"name" value:"\"eth0\""}} elem:{name:"state"}} mode:SAMPLE sample_interval:90000000000} encoding:JSON_IETF}', mode='STREAM', encoding='JSON_IETF', to 10.16.154.118:35000
2025/06/11 11:57:50.418932 [gnmic] target "10.16.154.118:35000": subscription default-1749643070 rcv error: rpc error: code = Unimplemented desc = GNMI Server is in PAUSE state. Please retry later when system CPU load is lesser
2025/06/11 11:57:50.418961 [gnmic] target "10.16.154.118:35000": subscription default-1749643070 rcv error: retrying in 10s
2025/06/11 11:58:00.419755 [gnmic] target "10.16.154.118:35000": subscription default-1749643070 rcv error: rpc error: code = Unimplemented desc = GNMI Server is in PAUSE state. Please retry later when system CPU load is lesser
2025/06/11 11:58:00.419881 [gnmic] target "10.16.154.118:35000": subscription default-1749643070 rcv error: retrying in 10s