Configuration
Set up the OcNOS router to transmit streaming telemetry data to a gNMI client using the dial-out method.
The sample configuration on the OcNOS router sets up streaming telemetry subscriptions using gNMI to monitor specific paths related to the state of Hard Disk, RAM, and Chassis. The router sends telemetry data to the specified collector over a configured tunnel connection. The gNMI client subscribed to these paths will receive updates regarding the state of RAM and Hard Disk at the specified intervals. This setup enables proactive monitoring and management of key hardware components on the network device.
Topology
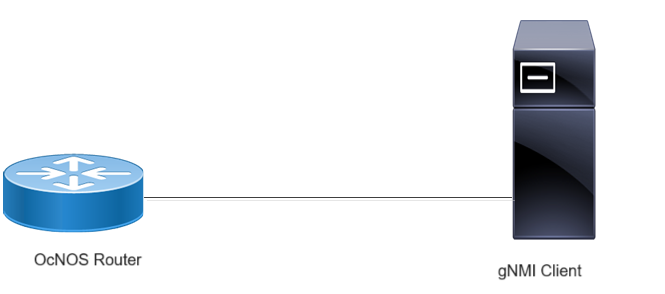
In this setup, an OcNOS router functions as the data source for streaming telemetry, while a gNMI client acts as the receiver of telemetry data. The OcNOS router sends telemetry data to the gNMI client over a dial-out connection.
Figure 10. Dial-out Streaming Telemetry Topology
Use Case 1: Configuring and Validating Telemetry on Management VRF
Before configuring Dial-out, meet all Prerequisites.
|
1.
|
Enable streaming telemetry on a management VRF. |
Copy
OcNOS(config)#feature streaming-telemetry vrf management
OcNOS(feature-telemetry-config)#exit
Create a sensor group (Platform) where sensor paths will be specified for dial-out subscriptions. Specify sensor paths within the sensor group (Platform) to monitor the chassis state.
Copy
OcNOS(config)#sensor-group Platform vrf management
OcNOS(telemetry-sensor-group)#sensor-path ipi:/components/component[name="CHASSIS"]/state
OcNOS(telemetry-sensor-group)#exit
|
3.
|
Create Destination Group |
Create a destination group (Collector2) where tunnel server settings will be configured for dial-out subscriptions. Specify the tunnel server (gNMI Client) IP address (10.21.3.4) and port (11123) within the destination group (Collector2).
Copy
OcNOS(config)#destination-group Collector2 vrf management
OcNOS(telemetry-grpc-tunnel-group)#tunnel-server ip 10.21.3.4 port 11123
OcNOS(telemetry-grpc-tunnel-group)#exit
|
4.
|
Create Persistent Subscription |
Establish a persistent subscription (storage2) with an encoding type (JSON-IETF). Associate it with the destination group (Collector2), and sensor group (Platform) to monitor the chassis state with a sample interval (95 seconds).
Copy
OcNOS(config)#subscription-name storage2 vrf management
OcNOS(telemetry-subscription)#encoding json-ietf
OcNOS(telemetry-subscription)#destination-group Collector2
OcNOS(telemetry-subscription)#sensor-group Platform sample-interval 95
OcNOS(telemetry-subscription)#commit
OcNOS(telemetry-subscription)#exit
|
5.
|
Verify the Running Configurations on Management VRF |
To confirm the configuration, use the show running-config streaming-telemetry command, which displays all configured settings, including sensor groups, destination groups, and subscriptions:
Copy
OcNOS#show running-config streaming-telemetry
!
feature streaming-telemetry vrf management
!
sensor-group Platform vrf management
 sensor-path ipi:/components/component[name="CHASSIS"]/state
!
destination-group Collector2 vrf management
 tunnel-server ip 10.21.3.4 port 11123
!
subscription-name storage2 vrf management
 destination-group Collector2
 sensor-group Platform sample-interval 95
!
|
6.
|
Validate theTelemetry Configuration on Management VRF |
Use the show streaming-telemetry persistent-subscriptions details command to verify the active telemetry sessions. The output should confirm:
|
•
|
Telemetry instances running on management VRF |
|
•
|
Active sensor paths (4) and sample intervals (10) |
|
•
|
Destination group status and configured IP:Port details 10.21.3.4:11123. |
|
•
|
Dial-out subscriptions marked as ACTIVE |
The validation output confirms that the telemetry subscription (storage2) is active, sending data to Collector2, and monitoring the chassis state at a 95-second interval.
Copy
OcNOS#show streaming-telemetry persistent-subscriptions details

 Number of telemetry instances : 1 (management)
 Platform type                 : High range
 Maximum sensor-paths          : 100
 Minimum sample-interval       : 10
 CPU monitoring                : ENABLED (NORMAL)
 CPU monitoring threshold      : 40
 Number of active sensor-paths : 4 (Dial-In : 0, Dial-out : 4)

 SI           : Sampling Interval in seconds
 Enc-Type     : Encoding type
 Origin:Path  : Sensor Path


 1. Subscription Details (VRF-Name: management):
 ~~~~~~~~~~~~~~~~~~~~~~~~~~~~~~~~~~~~~~~~~~~~~~~
   Port         : 9339
   TLS          : Disabled
   insecure-tls : False

 Dial-Out Subscription Details:
 ~~~~~~~~~~~~~~~~~~~~~~~~~~~~~~
 1. Subscription-name    : storage2
    Status               : ACTIVE
    Enc-Type             : JSON
    Tunnel-server details:
    ~~~~~~~~~~~~~~~~~~~~~~
    Tunnel-server Retry-interval  : Default-60 (seconds)

     Destination-group         Status         Tunnel-IP:Port
     -----------------         ------         --------------
     Collector2                ACTIVE      10.21.3.4:11123
    Sensor-group details:
    ~~~~~~~~~~~~~~~~~~~~~
    Sensor-group          SI            Origin:Path
    ------------         ----           -----------
       Platform            95           ipi:/components/component[name="CHASSIS"]/state
                                        [*]ipi:/components/component[name="CHASSIS"]/state/memory
                                        [*]ipi:/components/component[name="CHASSIS"]/state/board-fru
                                        [*]ipi:/components/component[name="CHASSIS"]/state/temperature

 [*]-> Indicates child path learnt from parent config, not configured by user
Use Case 2: Configuring and Validating Telemetry on a User-defined VRF
Before configuring Dial-out, meet all Prerequisites.
|
1.
|
Create the VRF VRF1 and enable streaming telemetry in a user-defined VRF on an OcNOS router. |
Copy
OcNOS(config)#ip vrf VRF1
OcNOS(config-vrf)#exit
OcNOS(config)#feature streaming-telemetry vrf VRF1
OcNOS(feature-telemetry-config)#exit
Create a sensor group (Platform) where sensor paths will be specified for dial-out subscriptions. Specify sensor paths within the sensor group (Platform) to monitor the state of RAM and Hard Disk.
Copy
OcNOS(config)#sensor-group Platform vrf VRF1
OcNOS(telemetry-sensor-group)#sensor-path ipi:/components/component[name="RAM"]/ram/state
OcNOS(telemetry-sensor-group)#sensor-path ipi:/components/component[name="HARD-DISK"]/storage/state
OcNOS(telemetry-sensor-group)#exit
|
3.
|
Create Destination Group |
Create a destination group (Collector3) where tunnel server settings will be configured for dial-out subscriptions. Specify the tunnel server (gNMI Client) IP address (10.21.3.4) and port (11123) within the destination group (Collector3).
Copy
OcNOS(config)#destination-group Collector3 vrf VRF1
OcNOS(telemetry-grpc-tunnel-group)#tunnel-server ip 10.21.3.4 port 11123
OcNOS(telemetry-grpc-tunnel-group)#exit
|
4.
|
Create Persistent Subscription |
Establish a persistent subscription (storage) with an encoding type (JSON-IETF). Associate it with the destination group (Collector3), and sensor group (Platform) to monitor the state of RAM and Hard Disk with a sample interval (95 seconds).
Copy
OcNOS(config)#subscription-name storage vrf VRF1
OcNOS(telemetry-subscription)#encoding json-ietf
OcNOS(telemetry-subscription)#destination-group Collector3
OcNOS(telemetry-subscription)#sensor-group Platform sample-interval 95
OcNOS(telemetry-subscription)#commit
OcNOS(telemetry-subscription)#exit
|
5.
|
Verify the Running Configurations on User-defined VRF |
To confirm the telemetry configuration, use the show running-config streaming-telemetry command, which displays all active settings, including enabled telemetry features, sensor groups, destination groups, and subscriptions:
Copy
OcNOS#show running-config streaming-telemetry
!
feature streaming-telemetry vrf VRF1
!
debug telemetry gnmi enable severity debug
!
sensor-group Platform vrf VRF1
 sensor-path ipi:/components/component[name="RAM"]/ram/state
 sensor-path ipi:/components/component[name="HARD-DISK"]/storage/state
!
destination-group Collector3 vrf VRF1
 tunnel-server ip 10.21.3.4 port 11123
!
subscription-name storage vrf VRF1
 destination-group Collector3
 sensor-group Platform sample-interval 95
!
|
6.
|
Validate the Telemetry Configuration on User-defined VRF |
To verify telemetry is actively streaming data, use the show streaming-telemetry persistent-subscriptions details command. The output confirms:
|
•
|
Telemetry instances running on VRF1 |
|
•
|
Number of active sensor paths (2) and sample intervals (10) |
|
•
|
Destination group status and configured IP:Port details 10.21.3.4:11123. |
|
•
|
Dial-out subscriptions marked as ACTIVE |
Copy
OcNOS#show streaming-telemetry persistent-subscriptions details

 Number of telemetry instances : 1 (VRF1)
 Platform type                 : High range
 Maximum sensor-paths          : 100
 Minimum sample-interval       : 10
 CPU monitoring                : ENABLED (NORMAL)
 CPU monitoring threshold      : 40
 Number of active sensor-paths : 2 (Dial-In : 0, Dial-out : 2)

 SI           : Sampling Interval in seconds
 Enc-Type     : Encoding type
 Origin:Path  : Sensor Path


 1. Subscription Details (VRF-Name: VRF1):
 ~~~~~~~~~~~~~~~~~~~~~~~~~~~~~~~~~~~~~~~~~
   Port         : 9339
   TLS          : Disabled
   insecure-tls : False

 Dial-Out Subscription Details:
 ~~~~~~~~~~~~~~~~~~~~~~~~~~~~~~
 1. Subscription-name    : storage
    Status               : ACTIVE
    Enc-Type             : JSON
    Tunnel-server details:
    ~~~~~~~~~~~~~~~~~~~~~~
    Tunnel-server Retry-interval  : Default-60 (seconds)

     Destination-group         Status         Tunnel-IP:Port
     -----------------         ------         --------------
     Collector3                ACTIVE      10.21.3.4:11123
    Sensor-group details:
    ~~~~~~~~~~~~~~~~~~~~~
    Sensor-group          SI            Origin:Path
    ------------         ----           -----------
       Platform            95           ipi:/components/component[name="RAM"]/ram/state
                                        ipi:/components/component[name="HARD-DISK"]/storage/state
Use Case 3: Configuring and Validating Telemetry on Default VRF
Before configuring Dial-out, meet all Prerequisites.
|
1.
|
Enable Streaming Telemetry in a default VRF on an OcNOS router. |
Copy
OcNOS(config)#feature streaming-telemetry
OcNOS(feature-telemetry-config)#exit
Create a sensor group (Platform) where sensor paths will be specified for dial-out subscriptions. Specify sensor paths within the sensor group (Platform) to monitor the state of RAM and Hard Disk.
Copy
OcNOS(config)#sensor-group Platform
OcNOS(telemetry-sensor-group)#sensor-path ipi:/components/component[name="RAM"]/ram/state
OcNOS(telemetry-sensor-group)#sensor-path ipi:/components/component[name="HARD-DISK"]/storage/state
OcNOS(telemetry-sensor-group)#exit
|
3.
|
Create Destination Group |
Create a destination group (Collector1) where tunnel server settings will be configured for dial-out subscriptions. Specify the tunnel server (gNMI Client) IP address (10.12.101.72) and port (11161) within the destination group (Collector1).
Copy
OcNOS(config)#destination-group Collector1
OcNOS(telemetry-grpc-tunnel-group)#tunnel-server ip 10.12.101.72 port 11161
OcNOS(telemetry-grpc-tunnel-group)#exit
|
4.
|
Create Persistent Subscription |
Establish a persistent subscription (storage) with an encoding type (JSON-IETF). Associate it with the destination group (Collector1), and sensor group (Platform) to monitor the state of RAM and Hard Disk with a sample interval (10 seconds).
Copy
OcNOS(config)#subscription-name storage
OcNOS(telemetry-subscription)#encoding json-ietf
OcNOS(telemetry-subscription)#destination-group Collector1
OcNOS(telemetry-subscription)#sensor-group Platform sample-interval 10
OcNOS(telemetry-subscription)#commit
OcNOS(telemetry-subscription)#exit
|
5.
|
Verify the Telemetry Running Configurations on default VRF |
To confirm the configuration, use the show running-config streaming-telemetry command, which displays all configured settings, including sensor groups, destination groups, and subscriptions:
Copy
OcNOS#show running-config streaming-telemetry
!
feature streaming-telemetry
!
debug telemetry gnmi enable severity debug
!
sensor-group Platform
 sensor-path ipi:/components/component[name="RAM"]/ram/state
 sensor-path ipi:/components/component[name="HARD-DISK"]/storage/state
!
destination-group Collector1
 tunnel-server ip 10.12.101.72 port 11161
!
subscription-name storage
 destination-group Collector1
 sensor-group Platform sample-interval 10
!
!
|
6.
|
Validate the Telemetry Configuration on Default VRF |
Use the show streaming-telemetry persistent-subscriptions details command to verify that telemetry is actively streaming data. The output confirms:
|
•
|
Telemetry instance running on the default VRF |
|
•
|
Number of active sensor paths (2) and sample intervals (10) |
|
•
|
Destination group status and configured IP:Port details (10.12.101.72:11161) |
|
•
|
Dial-out subscriptions marked as ACTIVE |
Copy
#show streaming-telemetry persistent-subscriptions details

 Number of telemetry instances : 1 (default)
 Platform type                 : High range
 Maximum sensor-paths          : 100
 Minimum sample-interval       : 10
 CPU monitoring                : ENABLED (NORMAL)
 CPU monitoring threshold      : 40
 Number of active sensor-paths : 2 (Dial-In : 0, Dial-out : 2)

 SI           : Sampling Interval in seconds
 Enc-Type     : Encoding type
 Origin:Path  : Sensor Path


 1. Subscription Details (VRF-Name: default):
 ~~~~~~~~~~~~~~~~~~~~~~~~~~~~~~~~~~~~~~~~~~~~
   Port         : 9339
   TLS          : Disabled
   insecure-tls : False

 Dial-Out Subscription Details:
 ~~~~~~~~~~~~~~~~~~~~~~~~~~~~~~
 1. Subscription-name    : storage
    Status               : ACTIVE
    Enc-Type             : JSON
    Tunnel-server details:
    ~~~~~~~~~~~~~~~~~~~~~~
    Tunnel-server Retry-interval  : Default-60 (seconds)

     Destination-group         Status         Tunnel-IP:Port
     -----------------         ------         --------------
     Collector1                ACTIVE      10.12.101.72:11161
    Sensor-group details:
    ~~~~~~~~~~~~~~~~~~~~~
    Sensor-group          SI            Origin:Path
    ------------         ----           -----------
       Platform            10           ipi:/components/component[name="RAM"]/ram/state
                                        ipi:/components/component[name="HARD-DISK"]/storage/state
Use Case 4: Configuring and Validating Telemetry with Multiple Key Sensor Paths in Management VRF
Before configuring Dial-out, meet all Prerequisites.
|
1.
|
Enable Streaming Telemetry in a Management VRF on an OcNOS router. |
Copy
OcNOS(config)#feature streaming-telemetry vrf management
OcNOS(feature-telemetry-config)#commit
OcNOS(feature-telemetry-config)#exit
Define a sensor group (bfd) to monitor the state of BFD session counters for IPv4 packets. Configure the sensor path using multiple key values.
|
•
|
OcNOS does not support the following sensor-path key-pattern combinations in dial-out mode. Avoid these configurations: |
|
•
|
Partial + Implicit sensor-path: ipi:/bgp/bgp-instances/bgp-instance[bgp-as=1*]/peers/peer/state |
|
•
|
Explicit + Implicit sensor-path: ipi:/bgp/bgp-instances/bgp-instance[bgp-as=*]/peers/peer/state |
|
•
|
Implicit + Explicit sensor-path: ipi:/bgp/bgp-instances/bgp-instance/peers/peer[peer-address=*]/state |
|
•
|
Ensure that sensor-path configurations use only supported wildcard types, explicit key values, or full implicit paths when setting up dial-out subscriptions. |
|
•
|
Sensor paths with partial wildcard cases involving integer key types do not function correctly; to see which key types are of Integer, refer to 'pyang' tree output. |
Copy
OcNOS(config)#sensor-group bfd vrf management
OcNOS(telemetry-sensor-group)#sensor-path ipi:/bfd/sessions/session[local-discriminator="2050"][vrf-name="default"]/state/counters/packets/ipv4
OcNOS(telemetry-sensor-group)#commit
OcNOS(telemetry-sensor-group)#exit
|
3.
|
Create Destination Group |
Configure the destination group (tunnel-1) with the gNMI client’s IP address (10.16.12.40) and port (11123).
Copy
OcNOS(config)#destination-group tunnel-1 vrf management
OcNOS(telemetry-grpc-tunnel-group)#tunnel-server ip 10.16.12.40 port 11123
OcNOS(telemetry-grpc-tunnel-group)#commit
OcNOS(telemetry-grpc-tunnel-group)#exit
|
4.
|
Create Persistent Subscription |
Create a persistent subscription (sub-1) and associate it with the tunnel-1 destination group and bfd sensor group. Set a sample interval of 100 seconds.
Copy
OcNOS(config)#subscription-name sub-1 vrf management
OcNOS(telemetry-subscription)#destination-group tunnel-1
OcNOS(telemetry-subscription)#sensor-group bfd sample-interval 100
OcNOS(telemetry-subscription)#commit
OcNOS(telemetry-subscription)#exit
|
5.
|
Verify the Telemetry Running Configurations for Multiple Key Sensor Paths |
To confirm the configuration, use the show running-config streaming-telemetry command. The output displays all configured settings, including sensor groups, destination groups, and subscriptions.
Copy
OcNOS#show running-config streaming-telemetry
!
feature streaming-telemetry vrf management
!
sensor-group bfd vrf management
 sensor-path ipi:/bfd/sessions/session[local-discriminator="2050"][vrf-name="default"]/state/counters/packets/ipv4
!
destination-group tunnel-1 vrf management
 tunnel-server ip 10.16.12.40 port 11123
!
subscription-name sub-1 vrf management
 destination-group tunnel-1
 sensor-group bfd sample-interval 100
!
!
|
6.
|
Validate the Telemetry Configuration for Multiple Key Sensor Paths |
Use the show streaming-telemetry command to confirm the telemetry instance is running and verify sensor group details. The expected output should confirm:
|
•
|
Telemetry is running on the management VRF |
|
•
|
One active sensor path for dial-out telemetry |
|
•
|
Configured subscription (sub-1) |
|
•
|
Destination group (tunnel-1) should be ACTIVE |
|
•
|
BFD sensor path is properly monitored at a 100-second sample interval |
Copy
OcNOS#show streaming-telemetry

 Number of telemetry instances : 1 (management)
 Platform type                 : Standard range
 Maximum sensor-paths          : 50
 Minimum sample-interval       : 90
 CPU monitoring                : ENABLED (NORMAL)
 CPU monitoring threshold      : 40
 Number of active sensor-paths : 1 (Dial-In : 0, Dial-out : 1)

 SI           : Sampling Interval in seconds
 Enc-Type     : Encoding type
 Origin:Path  : Sensor Path


 1. Subscription Details (VRF-Name: management):
 ~~~~~~~~~~~~~~~~~~~~~~~~~~~~~~~~~~~~~~~~~~~~~~~
   Port         : 9339
   TLS          : Disabled
   insecure-tls : False

 Dial-Out Subscription Details:
 ~~~~~~~~~~~~~~~~~~~~~~~~~~~~~~
 1. Subscription-name    : sub-1
    Status               : ACTIVE
    Enc-Type             : JSON
    Tunnel-server details:
    ~~~~~~~~~~~~~~~~~~~~~~
    Tunnel-server Retry-interval  : Default-60 (seconds)

     Destination-group         Status         Tunnel-IP:Port
     -----------------         ------         --------------
       tunnel-1                IN-ACTIVE      10.16.12.40:11123
    Sensor-group details:
    ~~~~~~~~~~~~~~~~~~~~~
    Sensor-group          SI            Origin:Path
    ------------         ----           -----------
            bfd           100           ipi:/bfd/sessions/session[local-discriminator="2050"][vrf-name="default"]/state/counters/packets/ipv4